Seattle Transit Safety: Spatiotemporal Risk Analysis
Built an operational intelligence analysis over 1.5 million Seattle crime records and GTFS transit stop data to identify high-risk transit nodes, peak exposure windows, and deployment priorities.
Tech: Python · Pandas · NumPy · SciPy KDTree · Geopy · Matplotlib · Seaborn
Approach
- Spatially joined 1.5 million SPD crime records with 3,200+ King County Metro GTFS stops using a 150 meter transit buffer.
- Built temporal risk profiles to compare transit-adjacent incidents against broader city patterns and isolate commuter risk windows.
- Created a weighted severity model and priority matrix to rank transit hubs by both incident volume and person-to-person safety impact.
Results
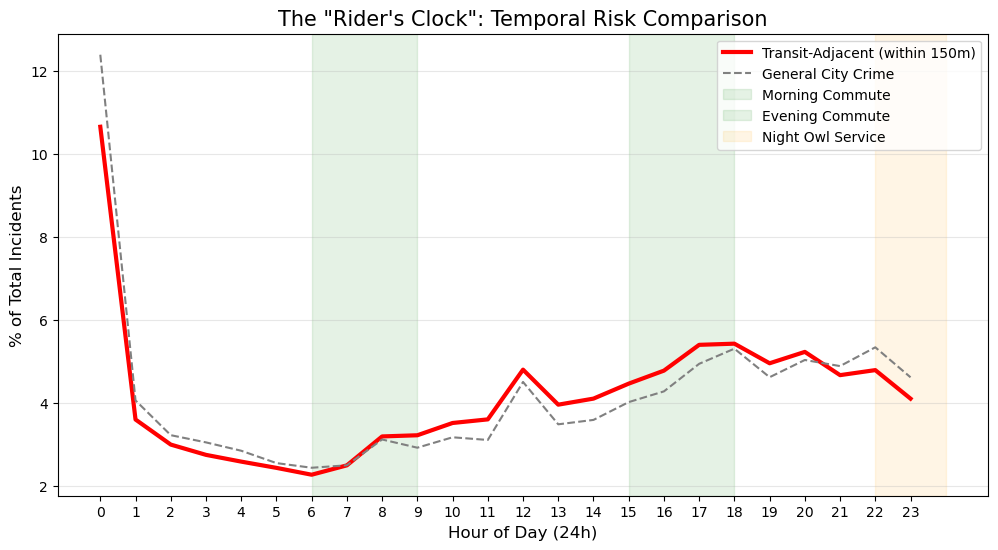
The rider's clock shows transit-adjacent risk climbing most sharply in the afternoon, especially from 13:00 to 18:00.
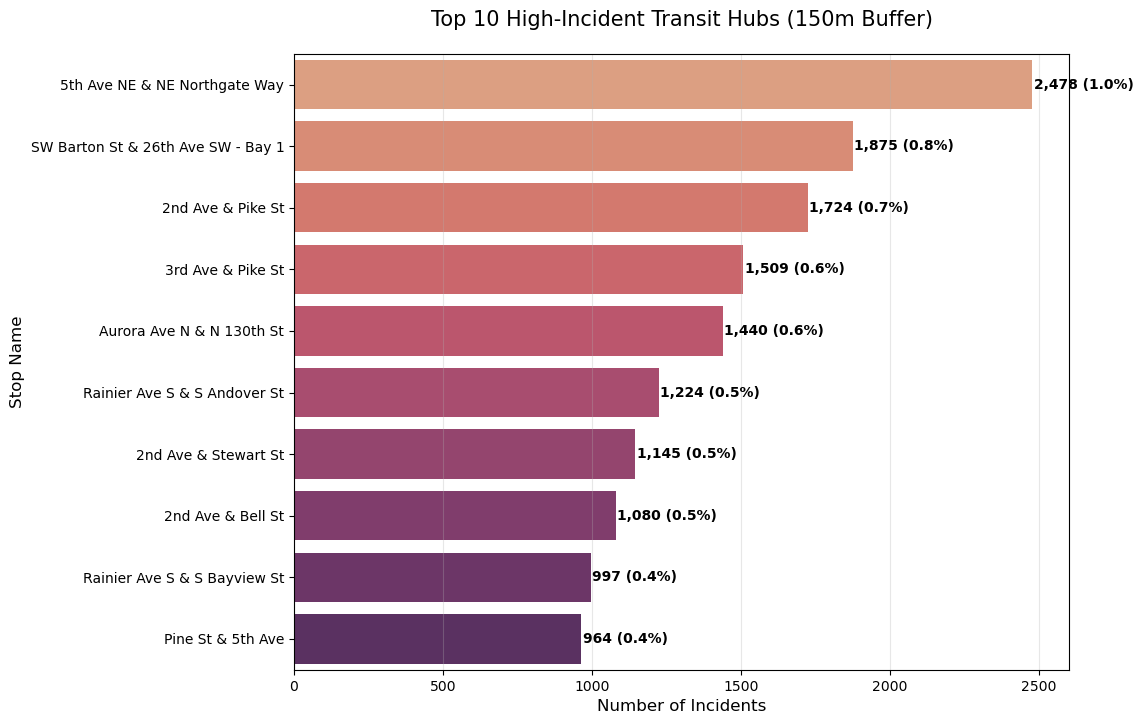
High-volume transit hubs reveal where a concentrated share of incidents occurs within walking distance of stops.
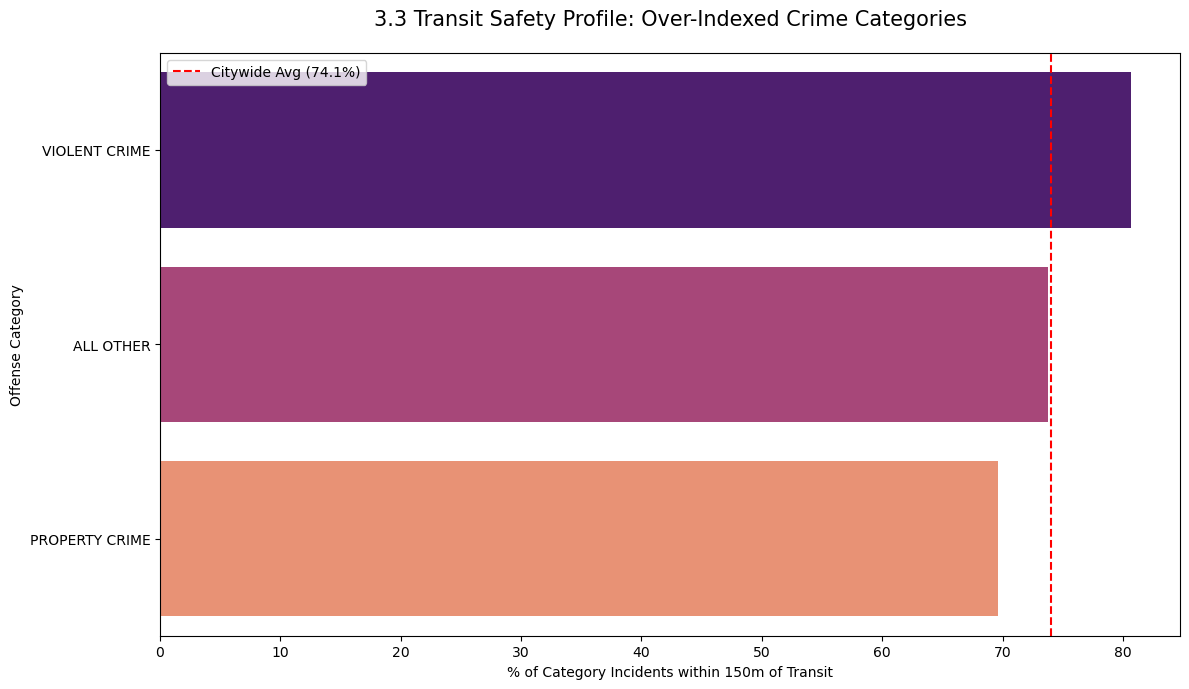
Violent crime is more concentrated near transit than the citywide average, which elevated priority scores for key downtown nodes.
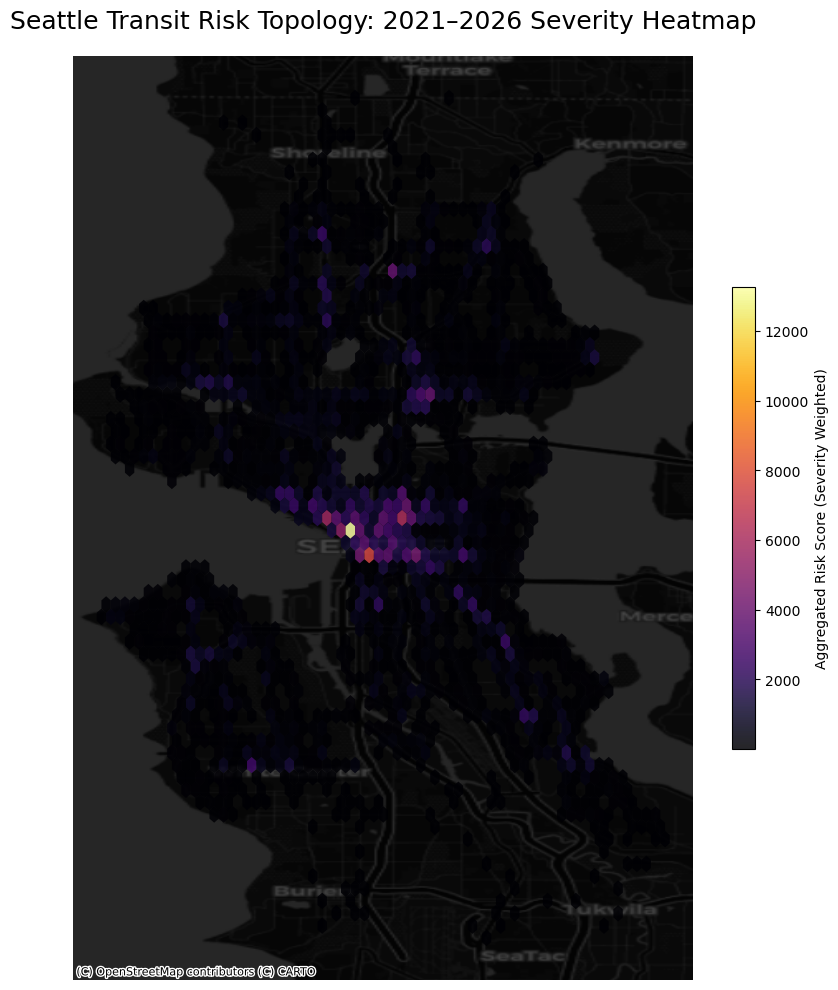
A weighted severity heatmap surfaces the downtown corridor as the dominant risk concentration, with 3rd Ave and Pike St emerging as the highest-severity node.